Data-Driven Results: Organizing Digital Agency
We will announce the data-based results of the organization building in Digital Agency.
- Organizational structure of Digital Agency
- Improving operational efficiency and productivity
- Efforts to ensure safety and transparency
- Organization building in Digital Agency
Organizational structure of Digital Agency
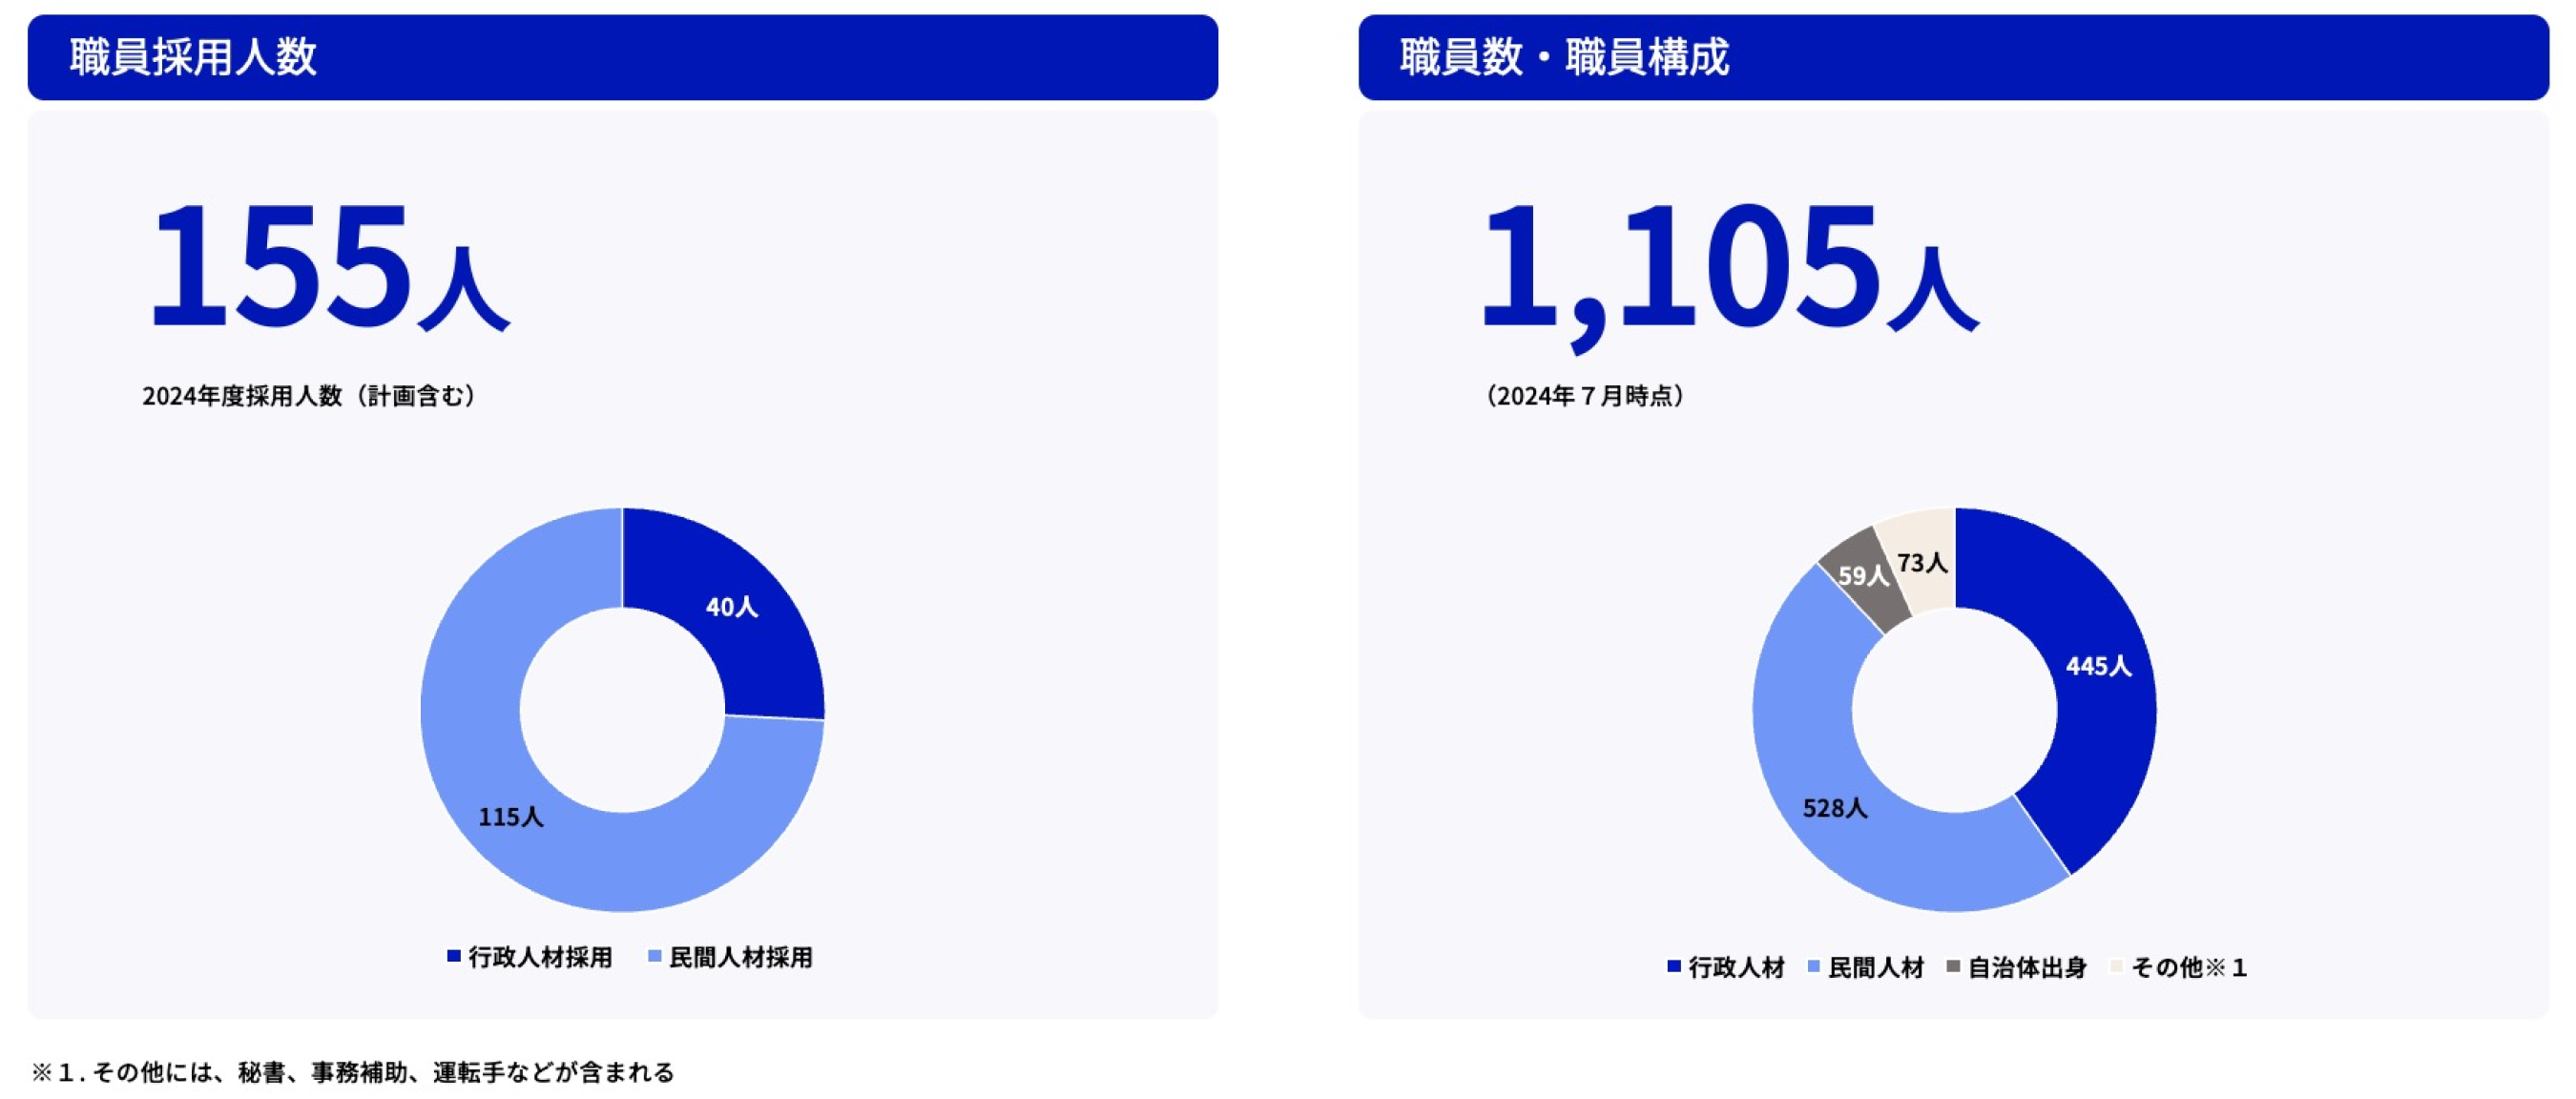
As of July 31, 2024, the total number of new employees, including those planned for fiscal 2024, was 155 in administrative personnel and private sector personnel, of which 445, or 40%, were in administrative personnel and 528, or 48%, in private sector personnel.
The progress is as follows.
- Number of employees hired
- Number of employees hired in fiscal 2024 (including planned): 155
- Administrative personnel hires: 40
- Private sector personnel hires: 115
- Number of employees hired in fiscal 2024 (including planned): 155
- Number and composition of staff
- As of July 2024:1,105
- Administrative personnel: 445
- Private sector personnel: 528
- From local governments: 59
- Others * 1 : 73
- As of July 2024:1,105
Related Information
Improving operational efficiency and productivity
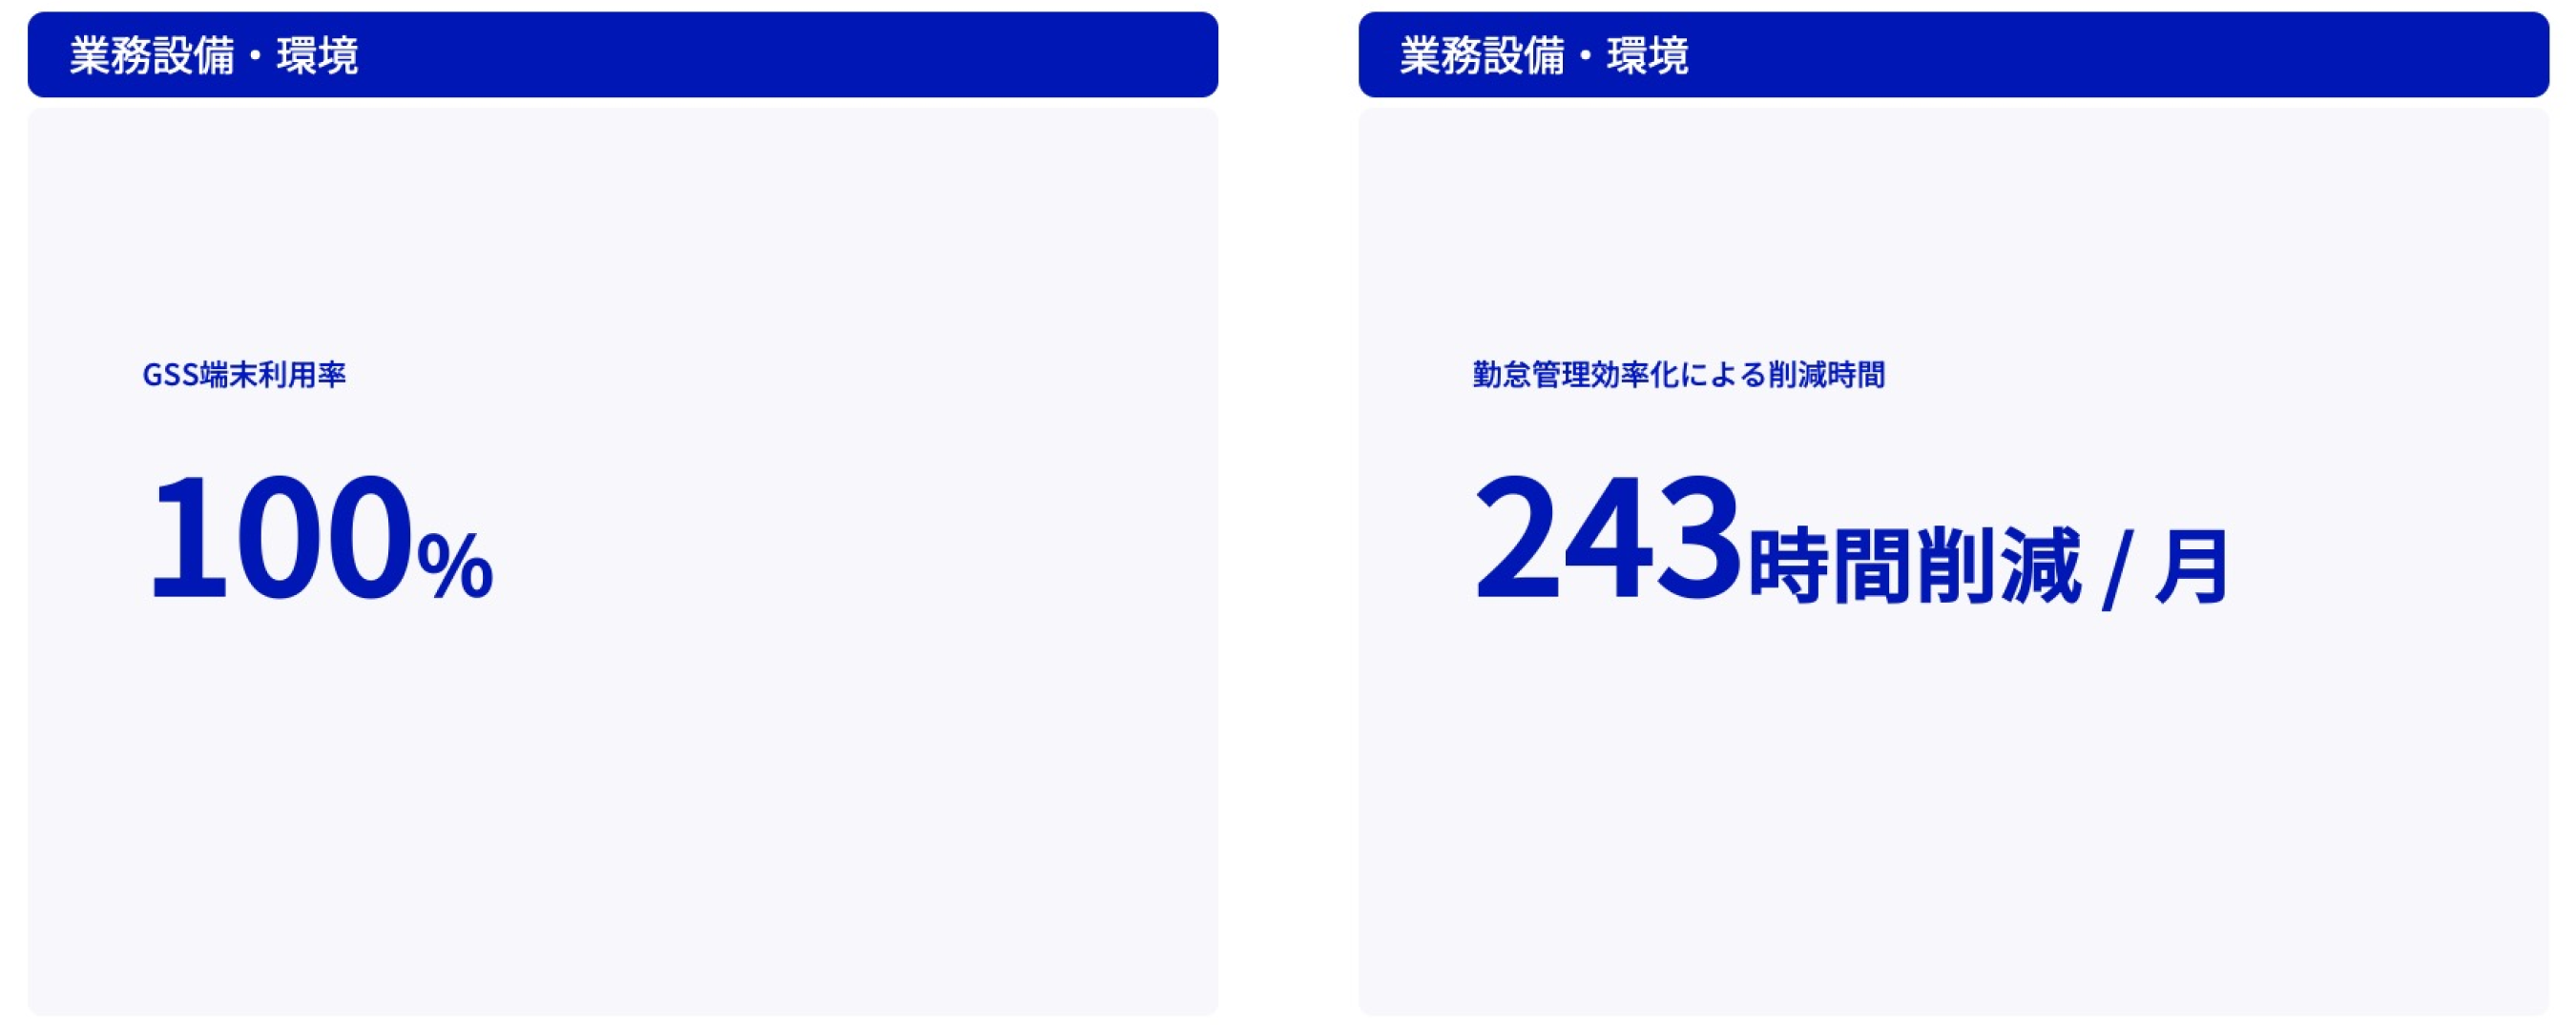
GSS terminals were used at 100% capacity in Digital Agency (excluding some employees who do not require PCs for work), and the introduction of an attendance app improved the efficiency of attendance management.
The progress is as follows.
- Business facilities and environment
- GSS terminal utilization: 100%
- Time savings through improved time management: 243 hours per month
Related Information
Efforts to ensure safety and transparency
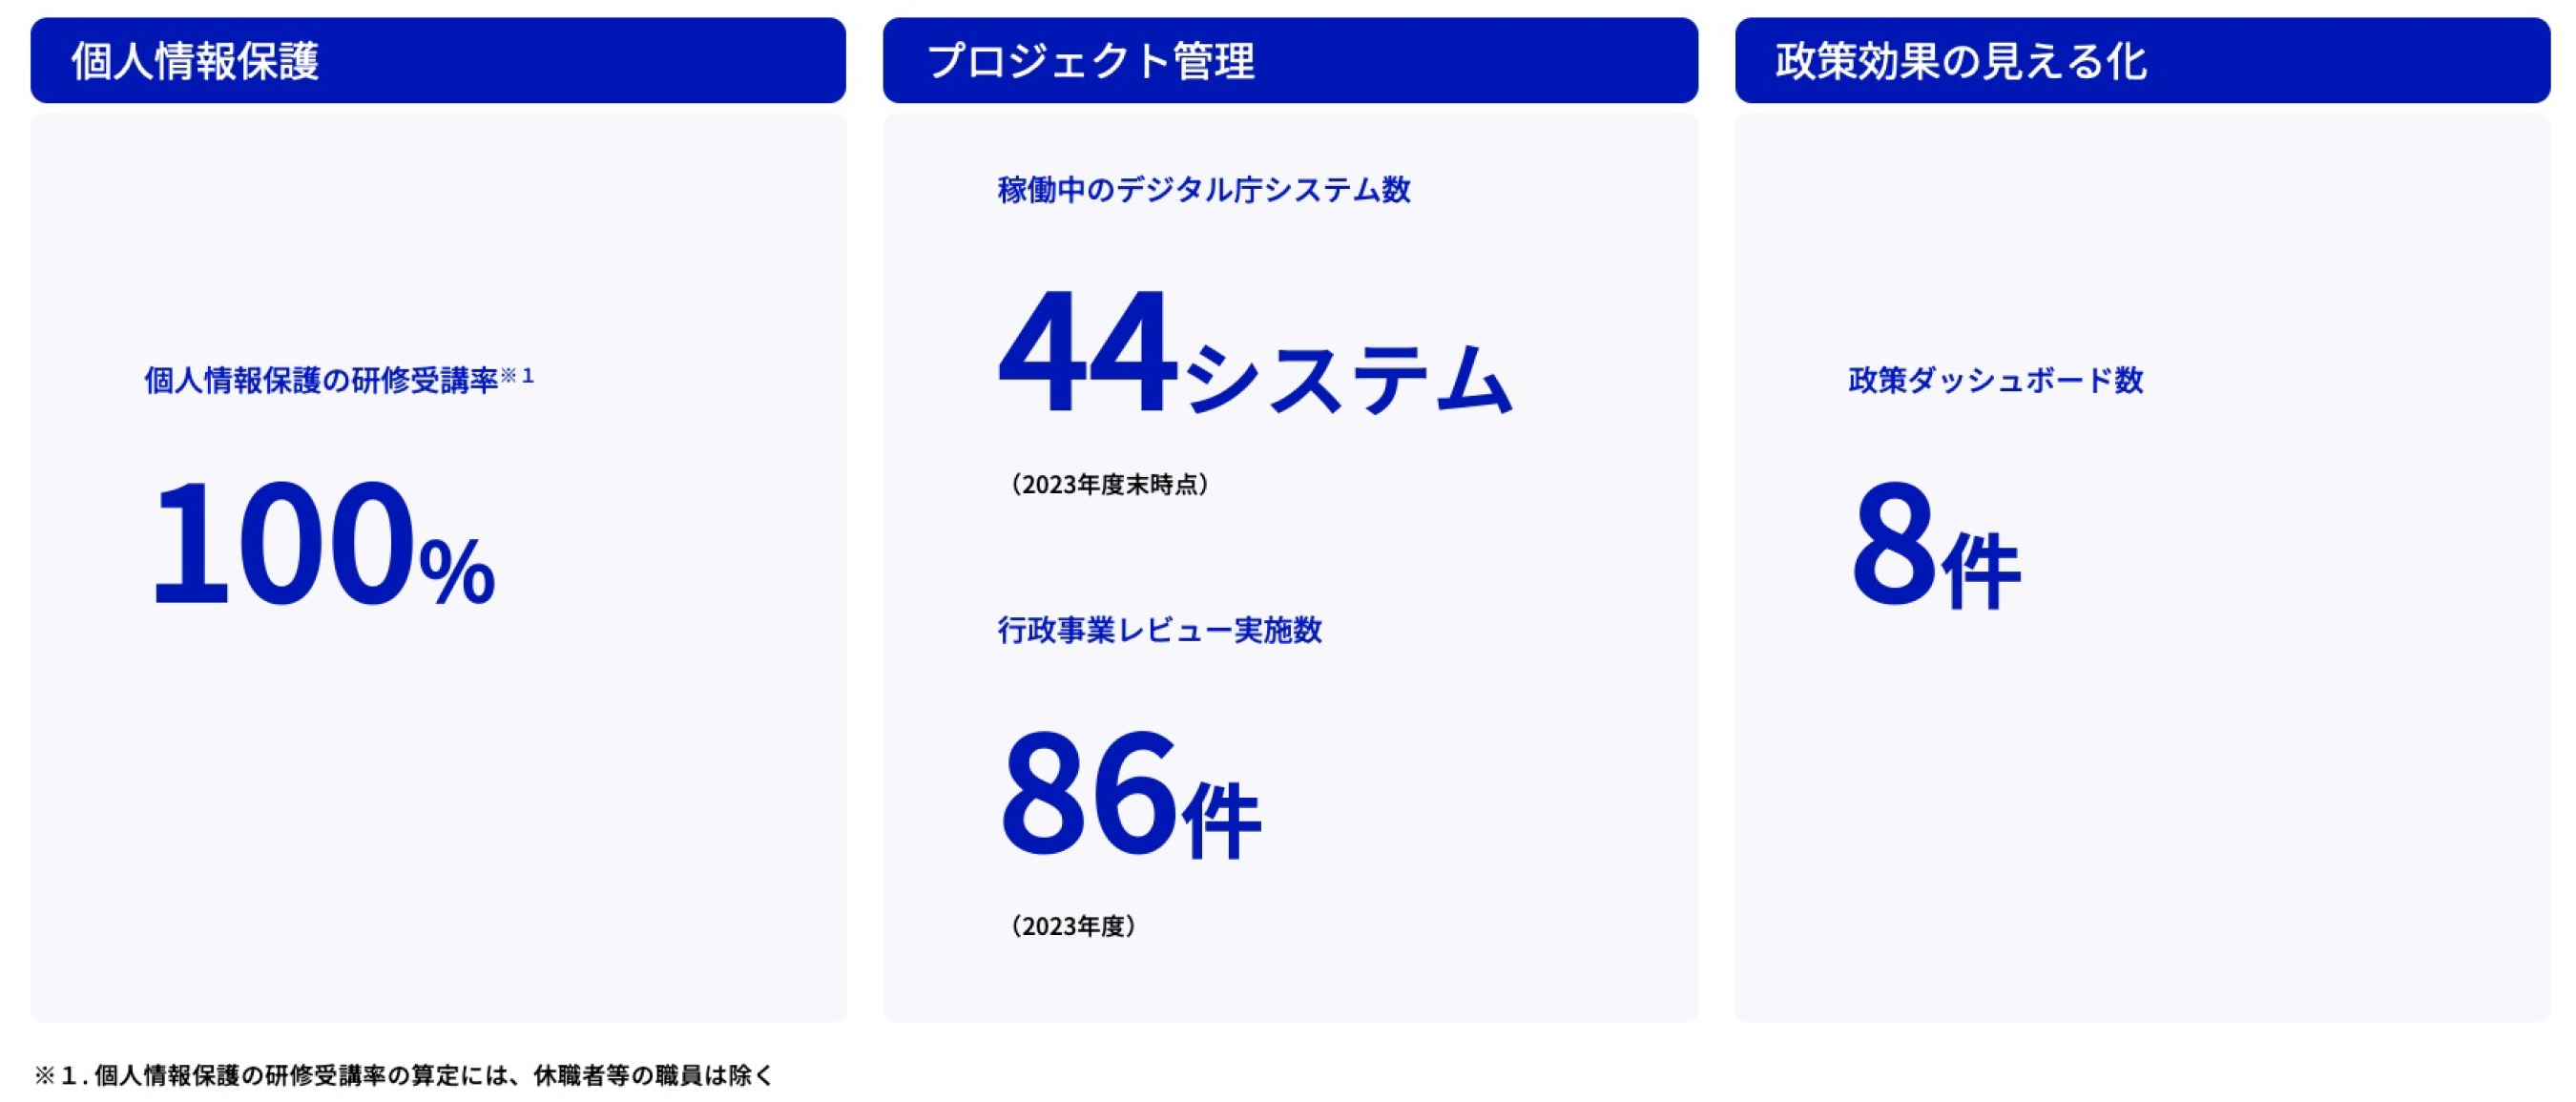
Management of system projects in operation. Visualization of external policy effects is also being disclosed on the dashboard.
The progress is as follows.
- Protection of personal information
- Personal data protection training participation rate * 2 : 100%
- Project Management
- Number of Digital Agency systems in operation
- As of the end of fiscal 2023:44 systems
- Number of administrative project reviews
- Fiscal 2023:86
- Number of Digital Agency systems in operation
- Visualization of Policy Effects
- Policy dashboards: 8
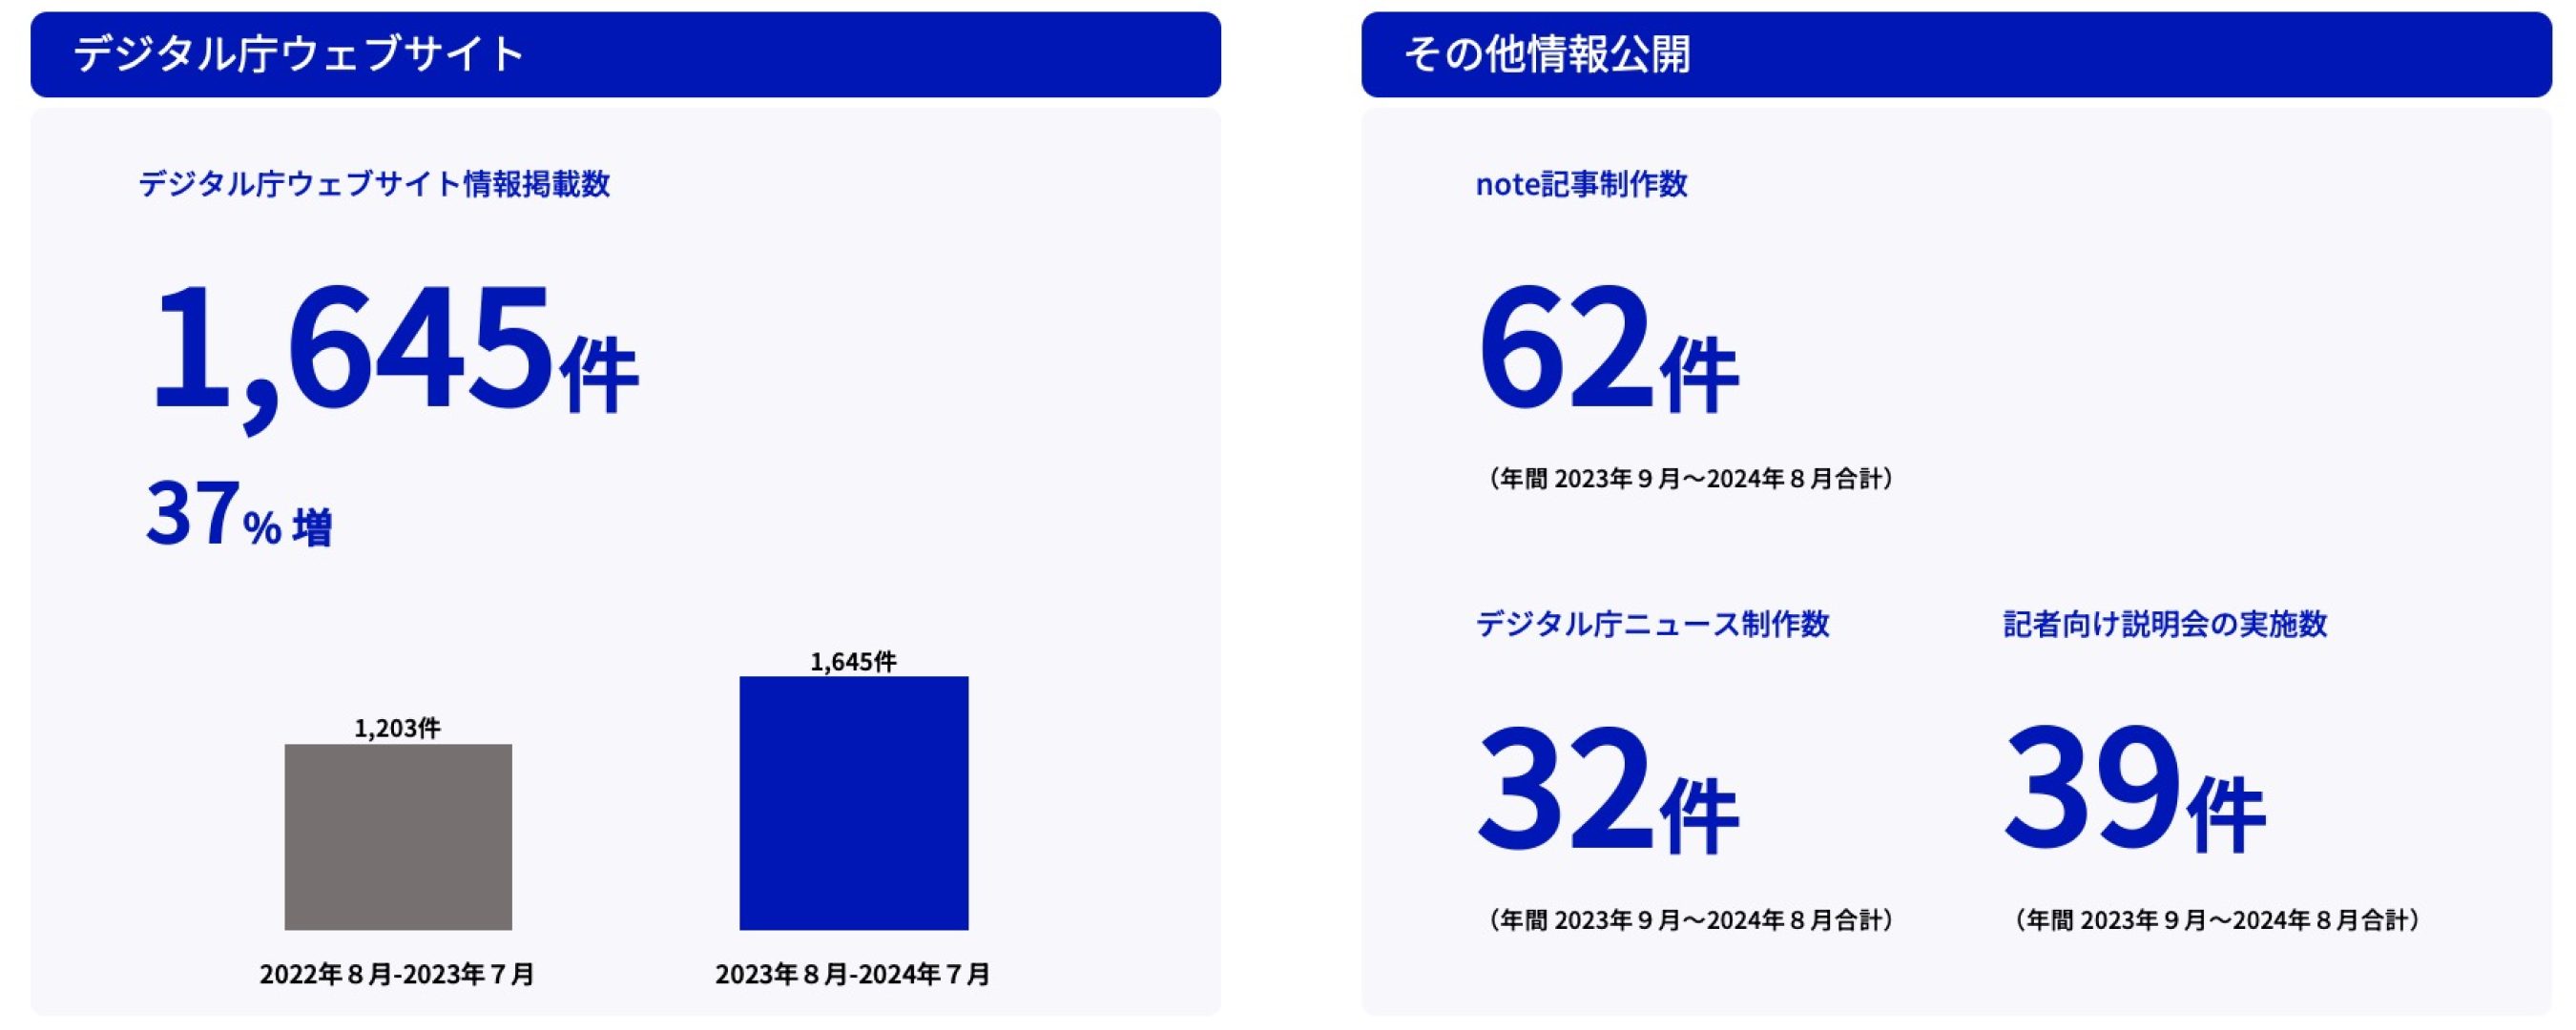
The number of information items posted on the Digital Agency website has also increased by 37% from the previous year (August 2022 to July 2023) to 1,645, and we are strengthening information dissemination using owned media in order to obtain a more detailed and accurate understanding of our measures.
The progress is as follows.
- Digital Agency Website
The number of Digital Agency website information postings was 1,645, an increase of 37% compared to the past year (August 2022 to July 2023).- August 2023 to July 2024:1,645
- August 2022 to July 2023:1,203
- Other Information Disclosure
- Number of note articles produced
- Annual (September 2023 to August 2024) Total: 62
- Number of Digital Agency News productions
- Annual (September 2023 to August 2024) Total: 32
- Number of briefing sessions for reporters
- Annual (September 2023 to August 2024) Total: 39
- Number of note articles produced
Related Information
- Control and supervision of national information systems
- Policy Evaluation and Administrative Project Review
- Digital Agency Official Note
- Digital Agency News
Organization building in Digital Agency
We regularly conduct employee surveys in Digital Agency to check the level of engagement and understanding of the MVV, and hold monthly meetings for all employees to share information.
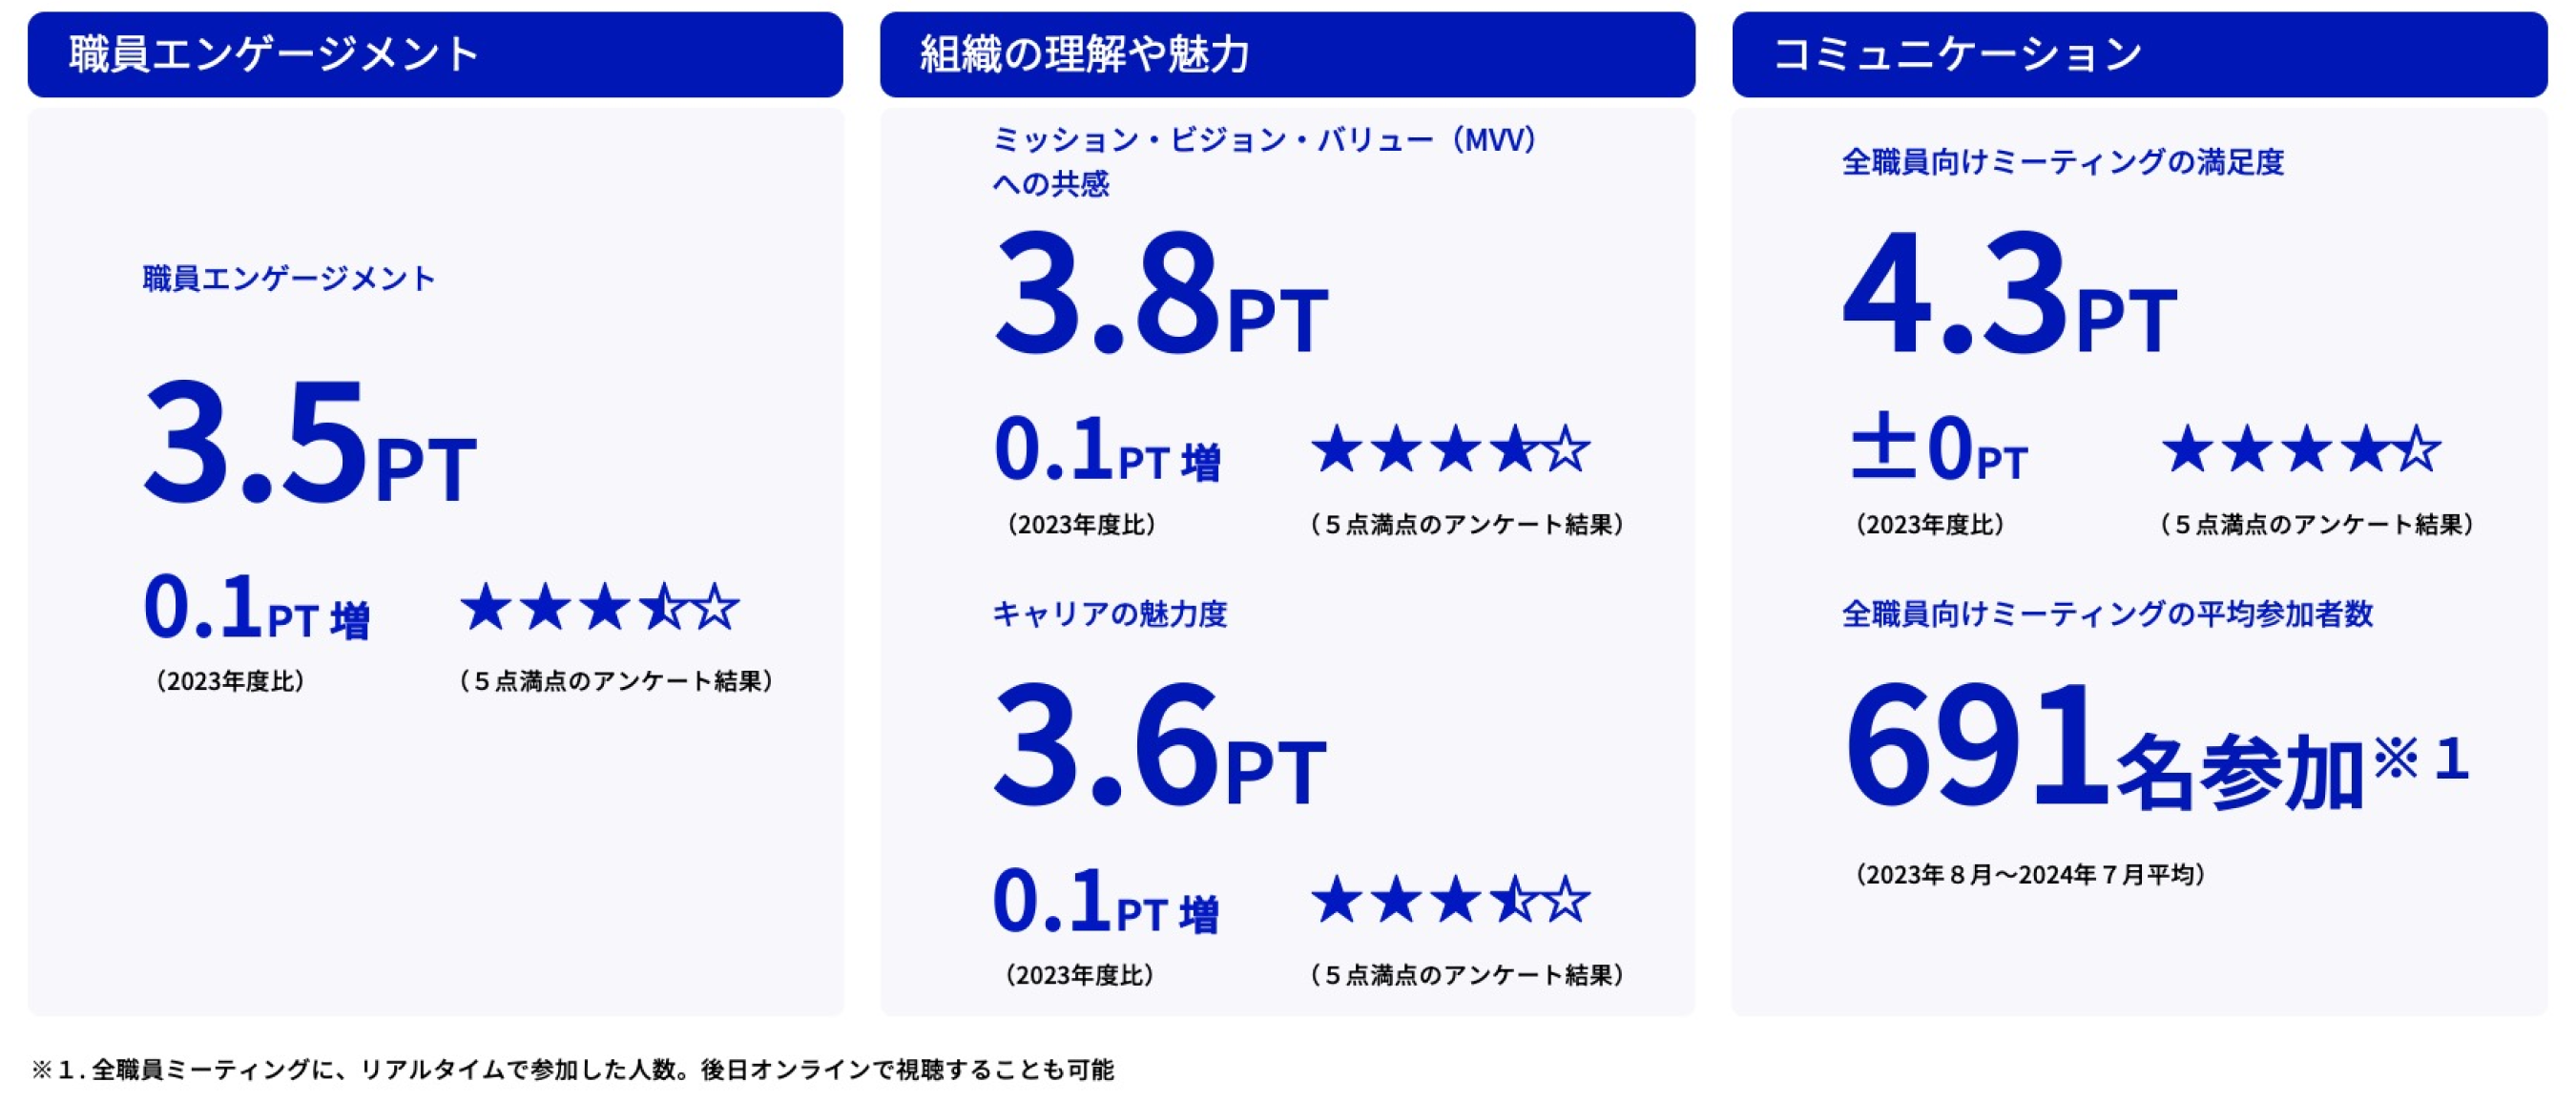
- Staff engagement
- Staff engagement
- The result of the questionnaire out of 5 points: 3.5 points, an increase of 0.1 points compared to 2023
- Staff engagement
- Understanding and attractiveness of the organization
- Sympathy with the Mission, Vision and Values (MVV)
- The result of the questionnaire out of 5 points: 3.8 points, an increase of 0.1 points compared to 2023
- Career Attractiveness
- The result of the questionnaire out of 5 points: 3.6 points, an increase of 0.1 points compared to 2023
- Sympathy with the Mission, Vision and Values (MVV)
- Communication
- Satisfaction with all staff meetings
- Results of questionnaire out of 5 points: 4.3 PT, ± 0 PT compared to FY 2023
- Average number of participants in all staff meetings
- Average from August 2023 to July 2024:691 participants * 3
- Satisfaction with all staff meetings
Related Information
Footnote
- * 1: Others include secretaries, administrative assistants, drivers, etc.
- * 2: Employees such as those on leave of absence are excluded from the calculation of the personal information protection training participation rate.
- * 3: The number of people who participated in the All Staff Meeting in real time. It can be viewed online at a later date.